 Version 2.4 Enterprise Platform Now Live
AI-powered ESG, carbon accounting, compliance, and sustainability intelligence platform for modern enterprises.
40%
Faster ESG Audit
90%
Automated Scope 1-3
100+
Metric Certifications
AI Decarbonization Suggestion
Optimize Scope 3 logistics route
Select a strategic pillar below to explore how CarbonSynq transforms your raw data into actionable enterprise value.
Comprehensive tracking across all scopes and supply chain tiers.
Actionable insights to optimize reduction and accelerate impact.
Seamless, audit-ready compliance for CSRD, SEC, and global standards.
Built on Global Climate Standards & Frameworks
About the PlatformDemystify CarbonSynq Zero! Wherever you are in your CarbonSynq Zero journey, CarbonSynq empowers you to measure & report scope 3 emissions in accordance with the GHG protocol, strategize & implement your path to CarbonSynq Zero — all in one platform.
Eliminate data silos and streamline your sustainability workflow with our comprehensive suite of tools.
Centralize all ESG metrics across departments into one secure, audit-ready database.
Generate reports aligned with GRI, CSRD, BRSR, and custom framework requirements effortlessly.
Engage and assess your supply chain emissions with automated vendor surveys and data collection.
Define and visualize key environmental and social issues that matter most to your stakeholders.
From data collection to CarbonSynq Zero planning — we've addressed every challenge across the emissions lifecycle.
Collecting scope 3 activity data is a time-consuming and cumbersome exercise requiring extensive collaboration between multiple stakeholders.
Scope 3 calculation methodologies vary significantly and require modifications to account for improvements in data collection capabilities.
Conducting manual scope 3 emission calculations every year demands considerable time and effort from your sustainability team.
Charting a long-term path to reach your CarbonSynq Zero goals is a daunting task with no clear visibility on progress or deviations.
Even after planning CarbonSynq Zero pathways, companies often struggle to navigate implementation complexities due to a lack of specialised expertise.
See how CarbonSynq handles your specific use case.
CarbonSynq streamlines & centralizes your scope 3 activity data collection, allowing stakeholders to upload relevant data seamlessly through bulk uploads & API integrations.
CarbonSynq allows for customizable calculation methodologies, which can be tailored to suit your specific data collection capabilities, and updated to align with improvements.
CarbonSynq reduces your sustainability team's annual burden by maximising repeatability of data collection & calculation configurations, automatically applied year on year.
CarbonSynq breaks down your long-term decarbonization goals into manageable annual targets, allowing you to gauge progress regularly and identify deviations.
CarbonSynq provides a curated network of vendors to help implement your CarbonSynq Zero strategy, covering decarbonization implementation, carbon offsetting & green financing.
From data collection to real-world implementation — every step is covered.
Seamlessly upload your scope 3 activity data through API integrations & bulk uploads, customise calculation methodologies to suit your data collection capabilities, and automate your scope 3 calculations for maximum repeatability.
Sync ERP, utility APIs, and supplier invoices.
Tailor your emission calculations by category.
Re-run calculations year-on-year seamlessly.
app.carbonsynqearth.com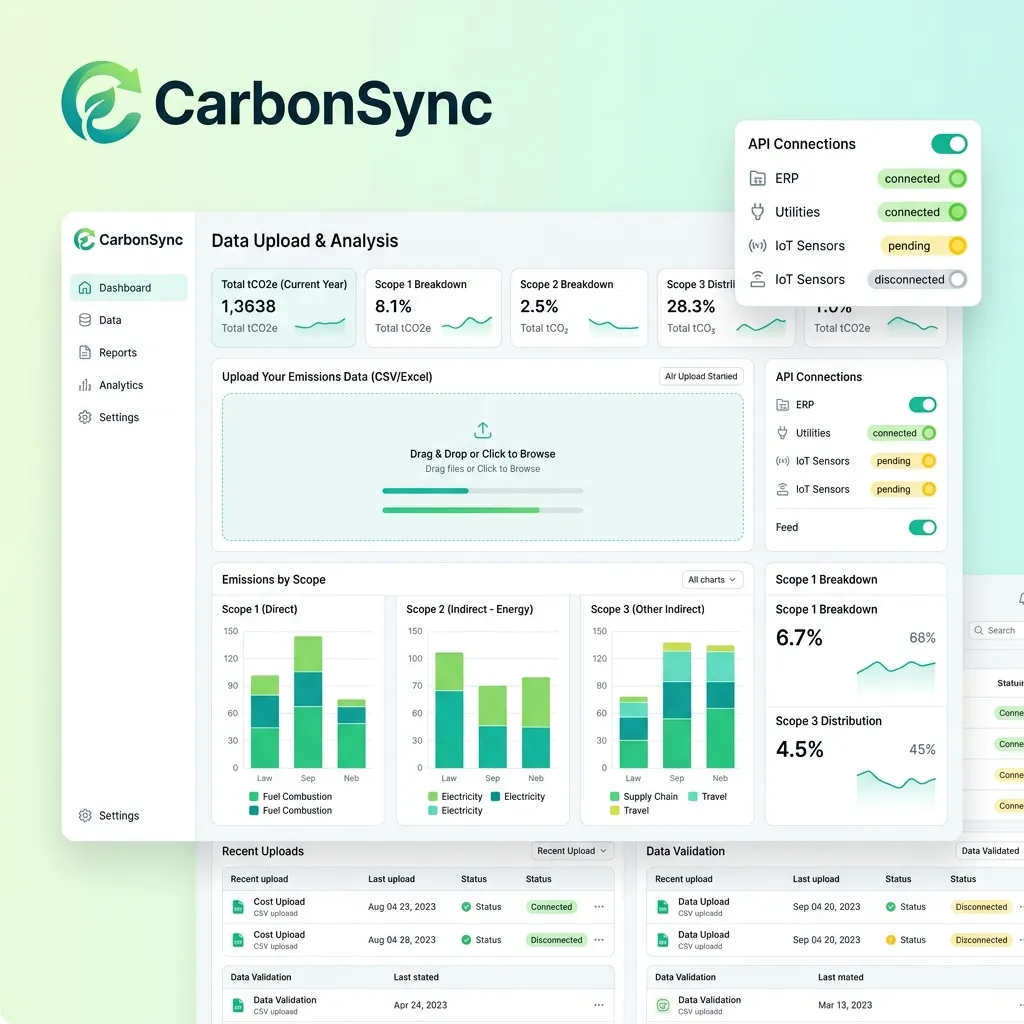
Achieving CarbonSynq Zero requires a structured, audit-ready framework. Our platform guides your teams through continuous mapping and dynamic auditing.
Establish live API integrations with electric utilities, cloud servers, shipping pipelines, and corporate ledgers to establish an audited carbon emission baseline.
Dynamic Decarbonization PipelineOffset Index
Verified through gold standard registry integrations. All offsets mapped dynamically to Scope 1 & 2 balances.
A carbon operating system for measurement, supplier engagement, compliance, and real reduction work.
Capability Map
Unifies ERP, utility, travel, procurement, supplier, and facility data into one governed carbon data layer.
API and bulk uploads for activity data
Invoice and document parsing queues
Data ownership, approvals, and validation rules
Live Outputs
Audit Packet
Frameworks
GHG Protocol, CSRD/ESRS, SEC, TCFD
Scope 3 depth
15 categories with supplier evidence workflows
Decision layer
Hotspots, forecasts, ROI, and target variance
Governance
Version history, approvals, evidence, and exports
Data Governance Layer
Serious GHG programs need more than calculations. EPA inventory guidance and GHG Protocol quality principles point to boundaries, methodologies, data management, base-year controls, roles, reviews, and verification as core parts of a high-quality inventory.
Traceability
source to report
Controls
review and approval
Versioning
factors and methods
Assurance
audit-ready evidence
Lock organizational and operational boundaries so Scope 1, 2, and 3 reporting starts from a consistent inventory perimeter.
Attach calculation logic, emission-factor versions, assumptions, and methodology changes to every reporting cycle.
Route invoices, utility data, supplier files, and activity uploads through quality checks before they become reportable numbers.
Track structural changes, acquisitions, divestments, and methodology updates without losing the original baseline story.
Give reviewers the evidence chain: source, owner, calculation, approval, disclosure mapping, and corrective action history.
Join 100+ Enterprise PacesettersStart mapping Scope 1, 2, and 3 emissions, generating compliant audit reports, and optimizing your logistics telemetry in days.
Each sector has distinct reporting requirements and operational pipelines. Select an industry to review target dashboards and metrics.
Ingest fuel registers, chemical processes, and raw material inputs. Mapped to GHG Protocols for high-precision reporting.
24,800t avg
-32% Scope 1
4 business days
Traditional spreadsheets and ad-hoc consultancy audits introduce latency, data leakage, and compliance risk. Meet the machine alternative.
Fragmented spreadsheets & custom consultants
Billing entries are hand-matched against carbon conversion tables once per year, causing massive delay and transcription errors.
Retainers are paid to boutique ESG advisory agencies to generate static, non-interactive PDF reports that are out of date instantly.
Supplier emissions are estimated using crude industry averages rather than actual vendor invoice telemetry.
Underprepared for upcoming strict SEC rules and EU CSRD directives, leading to potential audit rejections.
Continuous telemetry & AI-led decarbonization
Automated APIs collect data in real-time directly from electric meters, cloud servers, and transport databases.
Our machine engine simulates optimal adjustments (e.g. shift to rail freight, purchase local PPAs) and calculates ROI.
Request direct invoice tracking via automated vendor portals, delivering true Scope 3 reporting accuracy.
One-click generation of fully compliant SEC & EU CSRD reporting packets with complete trace logs.
Success Outcomes
Benchmarked from emissions-reduction ranges and ESG automation claims, then framed as practical platform outcomes.
A practical target range for organizations that convert measurement into energy, logistics, supplier, and process interventions.
A high-efficiency benchmark for replacing manual data chasing, spreadsheet consolidation, and report assembly with automated workflows.
Value Creation
CarbonSynq turns ESG operations into a tighter business system: faster data cycles, sharper cost decisions, and audit-ready reporting from the same source of truth.
Time
Lower
Spend
Lower
Risk
Lower
01
Less manual collection. Faster ESG cycles.
Automated ingestion, validation queues, and anomaly detection reduce spreadsheet-heavy work while keeping sustainability teams focused on decisions instead of chasing files.
02
Find spend-linked emissions hotspots.
Energy, freight, supplier, and product-level analysis helps teams prioritize reductions where carbon and operating cost move together.
03
Audit-ready from day one.
Framework mapping, evidence links, version history, approvals, and disclosure exports help teams prepare for CSRD/ESRS, SEC climate reporting, TCFD, and assurance reviews.
Industrial Applications
CarbonSynq adapts the same measurement, supplier, compliance, and reduction engine to different operational realities: factories, logistics networks, retail estates, and digital infrastructure.
Plant-level emissions control
Energy, process heat, materials
Connected data streams
Scope 3 network visibility
Freight, suppliers, warehousing
Connected data streams
Store and product footprinting
Stores, SKUs, packaging
Connected data streams
Digital carbon operations
Cloud, devices, offices
Connected data streams
One platform, sector-specific workflows
Shared carbon data model with different operational lenses for each team.
Getting started with CarbonSynq takes minutes, not months.
Identify the ESG metrics that apply to your business. Connect your data sources via API or bulk upload to get your baseline emissions profile.
Generate enterprise-grade emissions reports smarter and faster. Set science-based targets and simulate decarbonization strategies tailored to your sector.
Track and manage all your environmental, social and governance data in one platform. Execute reduction actions and verify offsets in real time.
Everything you need to know about preparing for your first carbon audit, managing suppliers, and tracking targets. Hover over a question to reveal the answer.
Yes. CarbonSynq pulls activity data from files, APIs, invoices, meters, and supplier inputs, then turns it into a governed baseline with validation queues and source evidence.
Each figure can be linked to source files, factor versions, calculation logic, reviewers, and approval history, so audit teams can follow the trail without rebuilding spreadsheets.
Central teams get governance, framework mapping, and portfolio views. Site teams get focused tasks for utility data, facility activity, supplier requests, and local evidence uploads.
Partners can support onboarding, methodology review, supplier data campaigns, assurance preparation, and reduction planning without breaking the customer evidence trail.
The platform supports sustainability leads, finance teams, procurement owners, consultants, and implementation teams. It is designed around accountable collaboration, not just dashboards.
Supplier requests can be structured by category, region, spend, and risk level. Procurement teams can track response quality, missing evidence, and fallback estimates without running everything through email.
Teams can start with bulk uploads and core integrations, then improve accuracy over time. The first baseline focuses on coverage, data quality, and clear gaps rather than waiting for perfect data.
CarbonSynq connects reporting to action. Hotspot analysis, reduction scenarios, initiative owners, and target tracking help teams decide which operational changes should happen next.
Finance teams can review source evidence, calculation logic, approval status, and period-over-period changes. That makes carbon data easier to reconcile with invoices, spend, assets, and business units.
CarbonSynq keeps methodologies and factor versions traceable, so teams can update calculations without losing the historical record behind previously reported numbers.
Yes. Teams can model energy shifts, logistics changes, supplier substitutions, renewable procurement, and offset strategies to compare carbon impact, cost tradeoffs, and implementation priority.